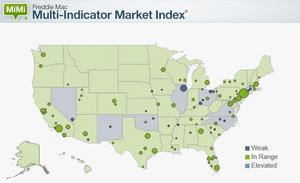
 MCLEAN, VA--(Marketwired - Dec 28, 2016) - Freddie Mac (OTCQB: FMCC) today released its Multi-Indicator Market Index® (MiMi®), showing the majority of the top 100 housing markets across the country steadily improving, with one additional state, Georgia, entering its outer historic benchmark range of housing activity.
The national MiMi value stands at 86.4, indicating a housing market that's on the outer edge of its historic benchmark range of housing activity with a +0.42 percent improvement from September to October and a three-month improvement of +1.86 percent. On a year-over-year basis, the national MiMi value improved +5.88 percent. Since its all-time low in October 2010, the national MiMi has rebounded 46 percent, but remains significantly off its high of 121.7.
News Facts:
- Forty-one of the 50 states plus the District of Columbia have MiMi values within range of their benchmark averages, with Colorado (98.6), Utah (101.5), Hawaii (98), Idaho (97.2) and Oregon at (96.8) ranking in the top five with scores closest to their historical benchmark index levels of 100.
- Seventy-seven of the 100 metro areas have MiMi values within range of their benchmark averages, with Dallas, TX (100.2), Nashville, TN (100.5), Honolulu, HI (100.8), Ogden, UT (100.8), and Los Angeles (99.1), ranking in the top five with scores closest to their historical benchmark index levels of 100.
- The most improving states month over month were Nevada (+1.96%), Connecticut (+1.45%), Arizona (+1.40%), South Carolina (+1.33%) and Washington (+1.31%). On a year-over-year basis, the most improving states were Nevada (+12.87%), Massachusetts (+12.77%), Florida (+11.65%), Mississippi (+11.53%) and Arizona (+10.28%).
- The most improving metro areas month over month were Springfield, MA (+1.96%), Tucson, AZ (+1.87%), Las Vegas, NV (+1.77%), Ogden, UT (+1.51%) and Worcester, MA (+1.48%). On a year-over-year basis, the most improving metro areas were Orlando, FL (+17.45%), Worcester, MA (+16.02%), Chattanooga, TN (+14.78%), Dallas, TX (+14.51%) and Tampa, FL (+14.45%).
- In October, 43 of the 50 states and 82 of the top 100 metros were showing an improving three-month trend. The same time last year, 30 states and 69 of the top 100 metro areas were showing an improving three-month trend.
Quote attributable to Freddie Mac Deputy Chief Economist Len Kiefer:
"The National MiMi stands at 86.4, a 5.88 percent year-over-year increase, but still below its historic benchmark normalized to 100. The purchase applications indicator is up nearly 20 percent from last year and is reflected in the recent better-than-expected existing and new home sales purchase data.
"MiMi does not yet capture the recent jump in mortgage rates since the election, which will drive down homebuyer affordability and likely dampen demand for home sales next year in some markets. While we see strong house price growth in markets like Dallas, Houston, Orlando, Phoenix and others, most are still well below their pre-2008 peak and still have significant room for improvement."
The 2016 MiMi release calendar pdf is available online.
MiMi monitors and measures the stability of the nation's housing market, as well as the housing markets of all 50 states, the District of Columbia, and the top 100 metro markets. MiMi combines proprietary Freddie Mac data with current local market data to assess where each single-family housing market is relative to its own long-term stable range by looking at home purchase applications, payment-to-income ratios (changes in home purchasing power based on house prices, mortgage rates and household income), proportion of on-time mortgage payments in each market, and the local employment picture. The four indicators are combined to create a composite MiMi value for each market. Monthly, MiMi uses this data to show, at a glance, where each market stands relative to its own stable range of housing activity. MiMi also indicates how each market is trending, whether it is moving closer to, or further away from, its stable range. A market can fall outside its stable range by being too weak to generate enough demand for a well-balanced housing market or by overheating to an unsustainable level of activity.
For more detail on MiMi see the FAQs. The most current version can be found at FreddieMac.com/mimi.
Freddie Mac was established by Congress in 1970 to provide liquidity, stability and affordability to the nation's residential mortgage markets. Freddie Mac supports communities across the nation by providing mortgage capital to lenders. Today Freddie Mac is making home possible for approximately one in four home borrowers and is the largest source of financing for multifamily housing. Additional information is available at FreddieMac.com, Twitter @FreddieMac and Freddie Mac's blog FreddieMac.com/blog.
The financial and other information contained in the documents that may be accessed on this page speaks only as of the date of those documents. The information could be out of date and no longer accurate. Freddie Mac does not undertake an obligation, and disclaims any duty, to update any of the information in those documents. Freddie Mac's future performance, including financial performance, is subject to various risks and uncertainties that could cause actual results to differ materially from expectations. The factors that could affect the company's future results are discussed more fully in our reports filed with the SEC.